Announcing CloudTrail Insights: Identify and Respond to Unusual API Activity
Building software in the cloud makes it easy to instrument systems for logging from the very beginning. With tools like AWS CloudTrail, tracking every action taken on AWS accounts and services is straightforward, providing a way to find the event that caused a given change. But not all log entries are useful. When things are running smoothly, those log entries are like the steady, reassuring hum of machinery on a factory floor. When things start going wrong, that hum can make it harder to hear which piece of equipment has gone a bit wobbly. The same is true with large scale software systems: the volume of log data can be overwhelming. Sifting through those records to find actionable information is tedious. It usually requires a lot of custom software or custom integrations, and can result in false positives and alert fatigue when new services are added.
That’s where software automation and machine learning can help. Today, we’re launching AWS CloudTrail Insights in all commercial AWS regions. CloudTrail Insights automatically analyzes write management events from CloudTrail trails and alerts you to unusual activity. For example, if there is an increase in TerminateInstance events that differs from established baselines, you’ll see it as an Insight event. These events make finding and responding to unusual API activity easier than ever.
Enabling AWS CloudTrail Insights
CloudTrail tracks user activity and API usage. It provides an event history of AWS account activity, including actions taken through the AWS Management Console, AWS SDKs, command line tools, and other AWS services. With the launch of AWS CloudTrail Insights, you can enable machine learning models that detect unusual activity in these logs with just a few clicks. AWS CloudTrail Insights will analyze historical API calls, identifying usage patterns and generating Insight Events for unusual activity.
You can also enable Insights on a trail from the AWS Command Line Interface (CLI) by using the put-insight-selectors command:
$ aws cloudtrail put-insight-selectors --trail-name trail_name --insight-selectors '{"InsightType": "ApiCallRateInsight"}'Once enabled, CloudTrail Insights sends events to the S3 bucket specified on the trail details page. Events are also sent to CloudWatch Events, and optionally to an CloudWatch Logs log group, just like other CloudTrail Events. This gives you options when it comes to alerting, from sophisticated rules that respond to CloudWatch events to custom AWS Lambda functions. After enabling Insights, historical events for the trail will be analyzed. Anomalous usage patterns found will appear in the CloudTrail Console within 30 minutes.
Using CloudTrail Insights
In this post we’ll take a look at some AWS CloudTrail Insights Events from the AWS Console. If you’d like to view Insight events from the AWS CLI, you use the CloudTrail LookupEvents call with the event-category parameter.
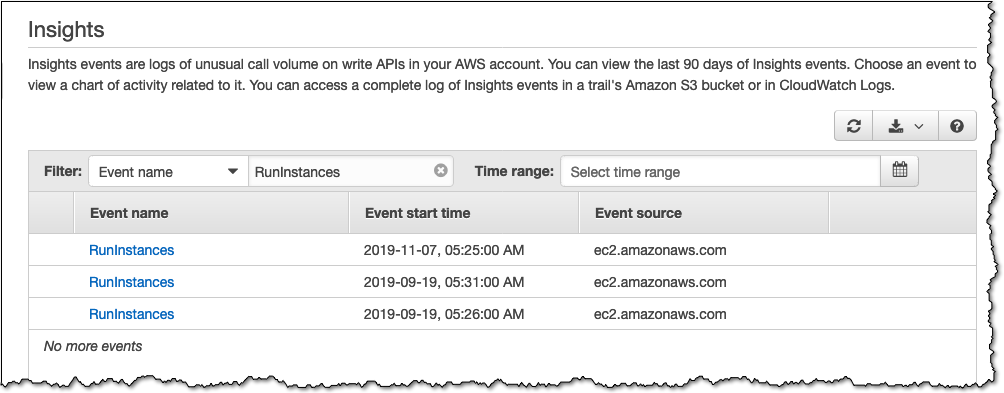
$ aws cloudtrail lookup-events --event-category insight [--max-item] [--lookup-attributes]Quickly scanning the list of CloudTrail Insights, the RunInstances event jumps out to me. Spinning up more EC2 instances can be expensive, and I’ve definitely mis-configured things such that I created more instances than needed before, so I want to take a closer look. Let’s filter the list down to just these events and see what we can learn from AWS CloudTrail Insights.
Let’s dig in to the latest event.
Here we see that over the course of one minute, there was a spike in RunInstances API call volume. From the Insights graph, we can see the raw event as JSON.
{
    "Records": [
        {
            "eventVersion": "1.07",
            "eventTime": "2019-11-07T13:25:00Z",
            "awsRegion": "us-east-1",
            "eventID": "a9edc959-9488-4790-be0f-05d60e56b547",
            "eventType": "AwsCloudTrailInsight",
            "recipientAccountId": "-REDACTED-",
            "sharedEventID": "c2806063-d85d-42c3-9027-d2c56a477314",
            "insightDetails": {
                "state": "Start",
                "eventSource": "ec2.amazonaws.com",
                "eventName": "RunInstances",
                "insightType": "ApiCallRateInsight",
                "insightContext": {
                    "statistics": {
                        "baseline": {
                            "average": 0.0020833333},
                        "insight": {
                            "average": 6}
                    }
                }
            },
            "eventCategory": "Insight"},
        {
            "eventVersion": "1.07",
            "eventTime": "2019-11-07T13:26:00Z",
            "awsRegion": "us-east-1",
            "eventID": "33a52182-6ff8-49c8-baaa-9caac16a96ce",
            "eventType": "AwsCloudTrailInsight",
            "recipientAccountId": "-REDACTED-",
            "sharedEventID": "c2806063-d85d-42c3-9027-d2c56a477314",
            "insightDetails": {
                "state": "End",
                "eventSource": "ec2.amazonaws.com",
                "eventName": "RunInstances",
                "insightType": "ApiCallRateInsight",
                "insightContext": {
                    "statistics": {
                        "baseline": {
                            "average": 0.0020833333},
                        "insight": {
                            "average": 6},
                        "insightDuration": 1}
                }
            },
            "eventCategory": "Insight"}
    ]}
Here we can see that the baseline API call volume is 0.002. That means that there’s usually one call to RunInstances roughly once every 500 minutes, so the activity we see in the graph is definitely not normal. By clicking over to the CloudTrail Events tab we can see the individual events that are grouped into this Insight event. It looks like this was probably a normal EC2 autoscaling activity, but I still want to dig in and confirm.
By expanding an event in this tab and clicking “View Event,” I can head directly to the event in CloudTrail for more information. After reviewing the event metadata and associated EC2 and IAM resources, I’ve confirmed that while this behavior was unusual, it’s not a cause for concern. It looks like autoscaling did what it was supposed to and that the correct type of instance was created.
Things to Know
Before you get started, here are some important things to know:
- CloudTrail Insights costs $0.35 for every 100,000 write management events analyzed for each Insight type. At launch, API call volume insights are the only type available.
- Activity baselines are scoped to the region and account in which the CloudTrail trail is operating.
- After an account enables Insights events for the first time, if an unusual activity is detected, you can expect to receive the first Insights events within 36 hours of enabling Insights..
- New unusual activity is logged as it is discovered, sending Insight Events to your destination S3 buckets and the AWS console within 30 minutes in most cases.
Let me know if you have any questions or feature requests, and happy building!
Source: AWS News


