New – Open Distro for Elasticsearch
Elasticsearch is a distributed, document-oriented search and analytics engine. It supports structured and unstructured queries, and does not require a schema to be defined ahead of time. Elasticsearch can be used as a search engine, and is often used for web-scale log analytics, real-time application monitoring, and clickstream analytics.
Originally launched as a true open source project, some of the more recent additions to Elasticsearch are proprietary. My colleague Adrian explains our motivation to start Open Distro for Elasticsearch in his post, Keeping Open Source Open. As strong believers in, and supporters of, open source software, we believe this project will help continue to accelerate open source Elasticsearch innovation.
Open Distro for Elasticsearch
 Today we are launching Open Distro for Elasticsearch. This is a value-added distribution of Elasticsearch that is 100% open source (Apache 2.0 license) and supported by AWS. Open Distro for Elasticsearch leverages the open source code for Elasticsearch and Kibana. This is not a fork; we will continue to send our contributions and patches upstream to advance these projects.
In addition to Elasticsearch and Kibana, the first release includes a set of advanced security, event monitoring & alerting, performance analysis, and SQL query features (more on those in a bit). In addition to the source code repo, Open Distro for Elasticsearch and Kibana are available as RPM and Docker containers, with separate downloads for the SQL JDBC and the PerfTop CLI. You can run this code on your laptop, in your data center, or in the cloud.
Contributions are welcome, as are bug reports and feature requests.
Inside Open Distro for Elasticsearch
Let’s take a quick look at the features that we are including in Open Distro for Elasticsearch. Some of these are currently available in Amazon Elasticsearch Service; others will become available in future updates.
Security – This plugin that supports node-to-node encryption, five types of authentication (basic, Active Directory, LDAP, Kerberos, and SAML), role-based access controls at multiple levels (clusters, indices, documents, and fields), audit logging, and cross-cluster search so that any node in a cluster can run search requests across other nodes in the cluster. Learn More…

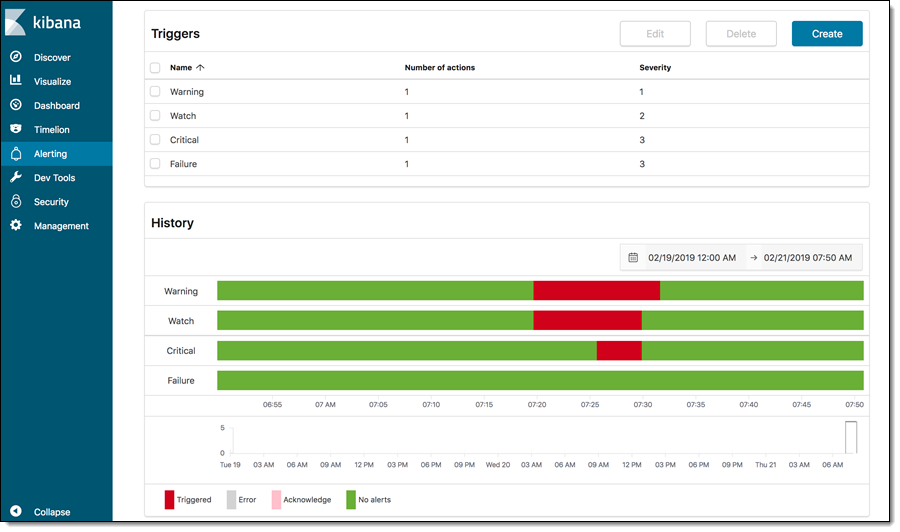
Event Monitoring & Alerting – This feature notifies you when data from one or more Elasticsearch indices meets certain conditions. You could, for example, notify a Slack channel if an application logs more than five HTTP 503 errors in an hour. Monitoring is based on jobs that run on a defined schedule, checking indices against trigger conditions, and raising alerts when a condition has been triggered. Learn More…

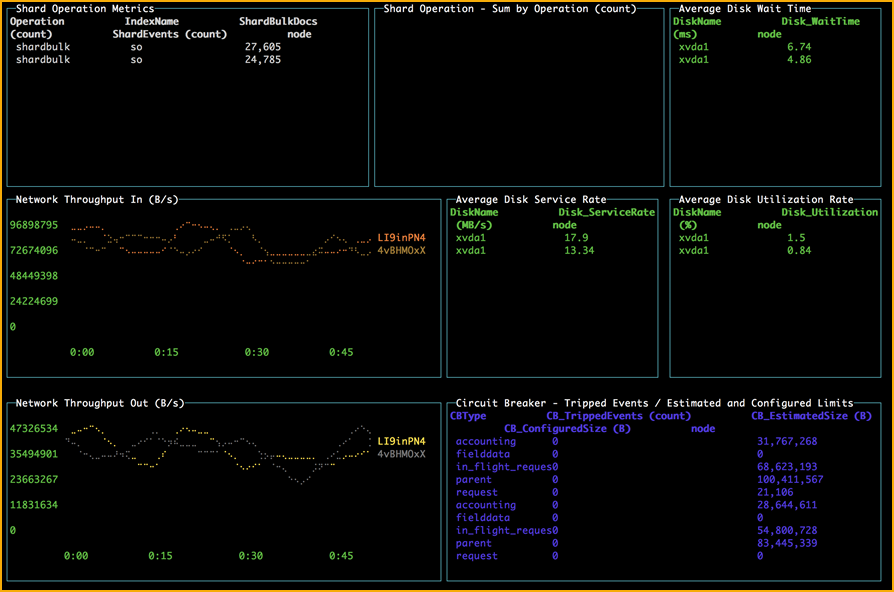
Deep Performance Analysis – This is a REST API that allows you to query a long list of performance metrics for your cluster. You can access the metrics programmatically or you can visualize them using perf top and other perf tools. Learn More…

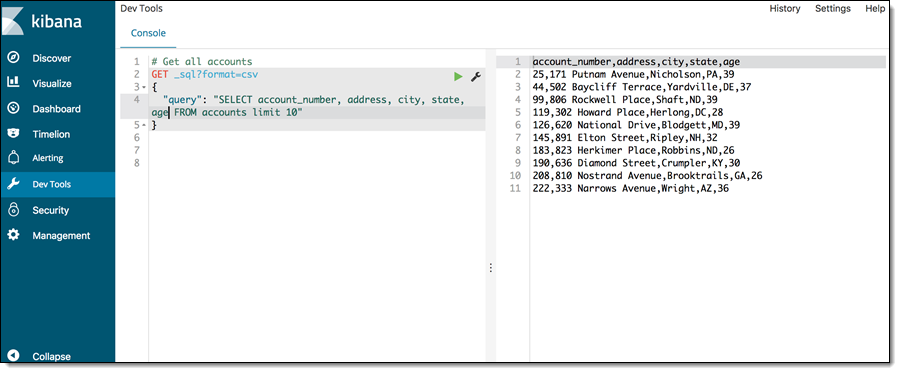
SQL Support – This feature allows you to query your cluster using SQL statements. It is an improved version of the elasticsearch-sql plugin, and supports a rich set of statements.

This is just the beginning; we have more in the works, and also look forward to your contributions and suggestions!
— Jeff;
Source: AWS News


