Public Preview – AWS Distro for OpenTelemetry
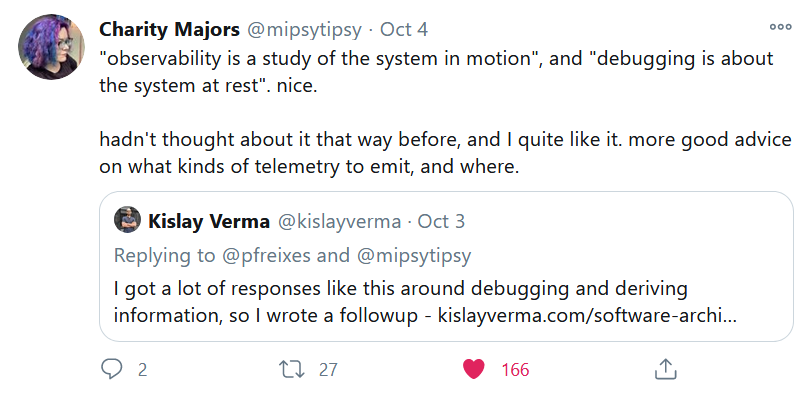
It took me a while to figure out what observability was all about. A year or two I asked around and my colleagues told me that I needed to follow Charity Majors and to read her blog (done, and done). Just this week, Charity tweeted:

Kislay’s tweet led to his blog post, Observing is not Debugging, which I found very helpful. As Charity noted, Kislay tells us that Observability is a study of the system in motion.
Today’s large-scale distributed applications and systems are effectively always in motion. Whether serving web requests, processing streams of data or handling events, something is always happening. At world-scale, looking at individual requests or events is not always feasible. Instead, it is necessary to take a statistical approach and to watch how well a system is working, instead of simply waiting for a total failure.
New AWS Distro for OpenTelemetry
 Today we are launching a preview of AWS Distro for OpenTelemetry. We are part of the Cloud Native Computing Foundation (CNCF)’s OpenTelemetry community, working to define an open standard for the collection of distributed traces and metrics. AWS Distro for OpenTelemetry is a secure and supported distribution of the APIs, libraries, agents, and collectors defined in the OpenTelemetry Specification.
One of the coolest features of the toolkit is auto instrumentation. Starting with Java and in the works for other languages and environments (.NET and JavaScript are next), the auto-instrumentation agent identifies the frameworks and languages used by your application and automatically instruments them to collect and forward metrics and traces.
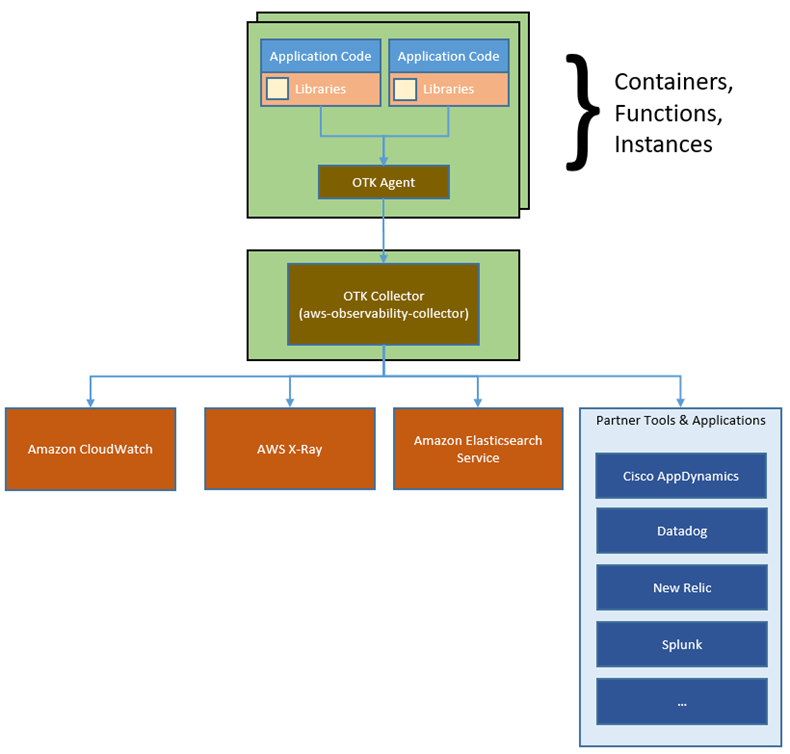
Here’s how all of the pieces fit together:

The AWS Observability Collector runs within your environment. It can be launched as a sidecar or daemonset for EKS, a sidecar for ECS, or an agent on EC2. You configure the metrics and traces that you want to collect, and also which AWS services to forward them to. You can set up a central account for monitoring complex multi-account applications, and you can also control the sampling rate (what percentage of the raw data is forwarded and ultimately stored).
Partners in Action
You can make use of AWS and partner tools and applications to observe, analyze, and act on what you see. We’re working with Cisco AppDynamics, Datadog, New Relic, Splunk, and other partners and will have more information to share during the preview. Here are some of their initial blog posts and offerings:
AppDynamics – What is OpenTelemetry and Why Should You Care?
Datadog – AWS Distro for OpenTelemetry will send metrics and traces to Datadog.
Grafana – AWS Distro for OpenTelemetry, Grafana, Prometheus, Loki, OpenMetrics, and beyond.
New Relic – New Relic, AWS, and OpenTelemetry: Cloud Observability, Simplified.
Things to Know
The preview of the AWS Distro for OpenTelemetry is available now and you can start using it today. In addition to the .NET and JavaScript support that I mentioned earlier, we plan to support Python, Ruby, Go, C++, Erlang, and Rust as well.
This is an open source project and welcome your pull requests! We will be tracking the upstream repository and plan to release a fresh version of the toolkit quarterly.
— Jeff;
PS – Be sure to sign up for our upcoming webinar, Observability at AWS and AWS Distro for OpenTelemetry Deep Dive.
Source: AWS News


