New Amazon FinSpace Simplifies Data Management and Analytics for Financial Services
Managing data is the core of the Financial Services Industry (FSI). I worked for private banking and fund management companies and helped analysts to collect, aggregate, and analyze hundreds of petabytes of data from internal data sources, such as portfolio management, order management, and accounting systems, but also from external data sources, such as real-time market feeds and historical equities pricing and alternative data systems. During that period, I spent my time trying to access data across organizational silos, to manage permissions, and to build systems to automate recurring tasks in ever-growing and more complex environments.
Today, we are launching a solution that would have reduced the time I spent on such projects: Amazon FinSpace is a data management and analytics solution purpose-built for the financial services industry. Amazon FinSpace reduces the time it takes to find and prepare data from months to minutes so analysts can spend more time on analysis.
What Our Customers Told Us
Before data can be combined and analyzed, analysts spend weeks or months to find and access data across multiple departments, each specialized by market, instrument, or geography. In addition to this logical segregation, data is also physically isolated in different IT systems, file systems, or networks. Because access to data is strictly controlled by governance and policy, analysts must prepare and explain access requests to the compliance department. This is a very manual, ad-hoc process.
Once granted access, they often must perform computational logic (such as Bollinger Bands, Exponential Moving Average, or Average True Range) on larger and larger datasets to prepare data for analysis or to derive information out of the data. These computations often run on servers with constrained capacity, as they were not designed to handle the size of workloads in the modern financial world. Even server-side systems are struggling to scale up and keep up with the ever-growing size of the datasets they need to store and analyze.
How Amazon FinSpace Helps
Amazon FinSpace removes the undifferentiated heavy lifting required to store, prepare, manage, and audit access to data. It automates the steps involved in finding data and preparing it for analysis. Amazon FinSpace stores and organizes data using industry and internal data classification conventions. Analysts connect to the Amazon FinSpace web interface to search for data using familiar business terms (“S&P500,” “CAC40,” “private equity funds in euro”).
Analysts can prepare their chosen datasets using a built-in library of more than 100 specialized functions for time series data. They can use the integrated Jupyter notebooks to experiment with data, and parallelize these financial data transformations at the scale of the cloud in minutes. Finally, Amazon FinSpace provides a framework to manage data access and to audit who is accessing what data and when. It tracks usage of data and generates compliance and audit reports.
Amazon FinSpace also makes it easy to work on historical data. Let’s imagine I built a model to calculate credit risk. This model relies on interest rate and inflation rate. These two rates get updated frequently. The risk level associated with a customer is not the same today as it was a few months ago, when inflation and interest rates were different. When data analysts are looking at data as it is now and as it was in the past, they call it bitemporal modeling. Amazon FinSpace makes it easy to go back in time and to compare how models are evolving alongside multiple dimensions.
To show you how Amazon FinSpace works, let’s imagine I have a team of analysts and data scientists and I want to provide them a tool to search, prepare, and analyze data.
How to Create an Amazon FinSpace Environment
As an AWS account administrator, I create a working environment for my team of financial analysts. This is a one-time setup.
I navigate to the Amazon FinSpace console and click Create Environment:

I give my environment a name. I select a KMS encryption key that will serve to encrypt data at rest. Then I choose either to integrate with AWS Single Sign-On or to manage usernames and passwords in Amazon FinSpace. AWS Single Sign-On integration allows your analysts to authenticate with external systems, such as a corporate Active Directory, to access the Amazon FinSpace environment. For this example, I choose to manage the credentials by myself.

I create a superuser who will have administration permission on the Amazon FinSpace environment. I click Add Superuser:
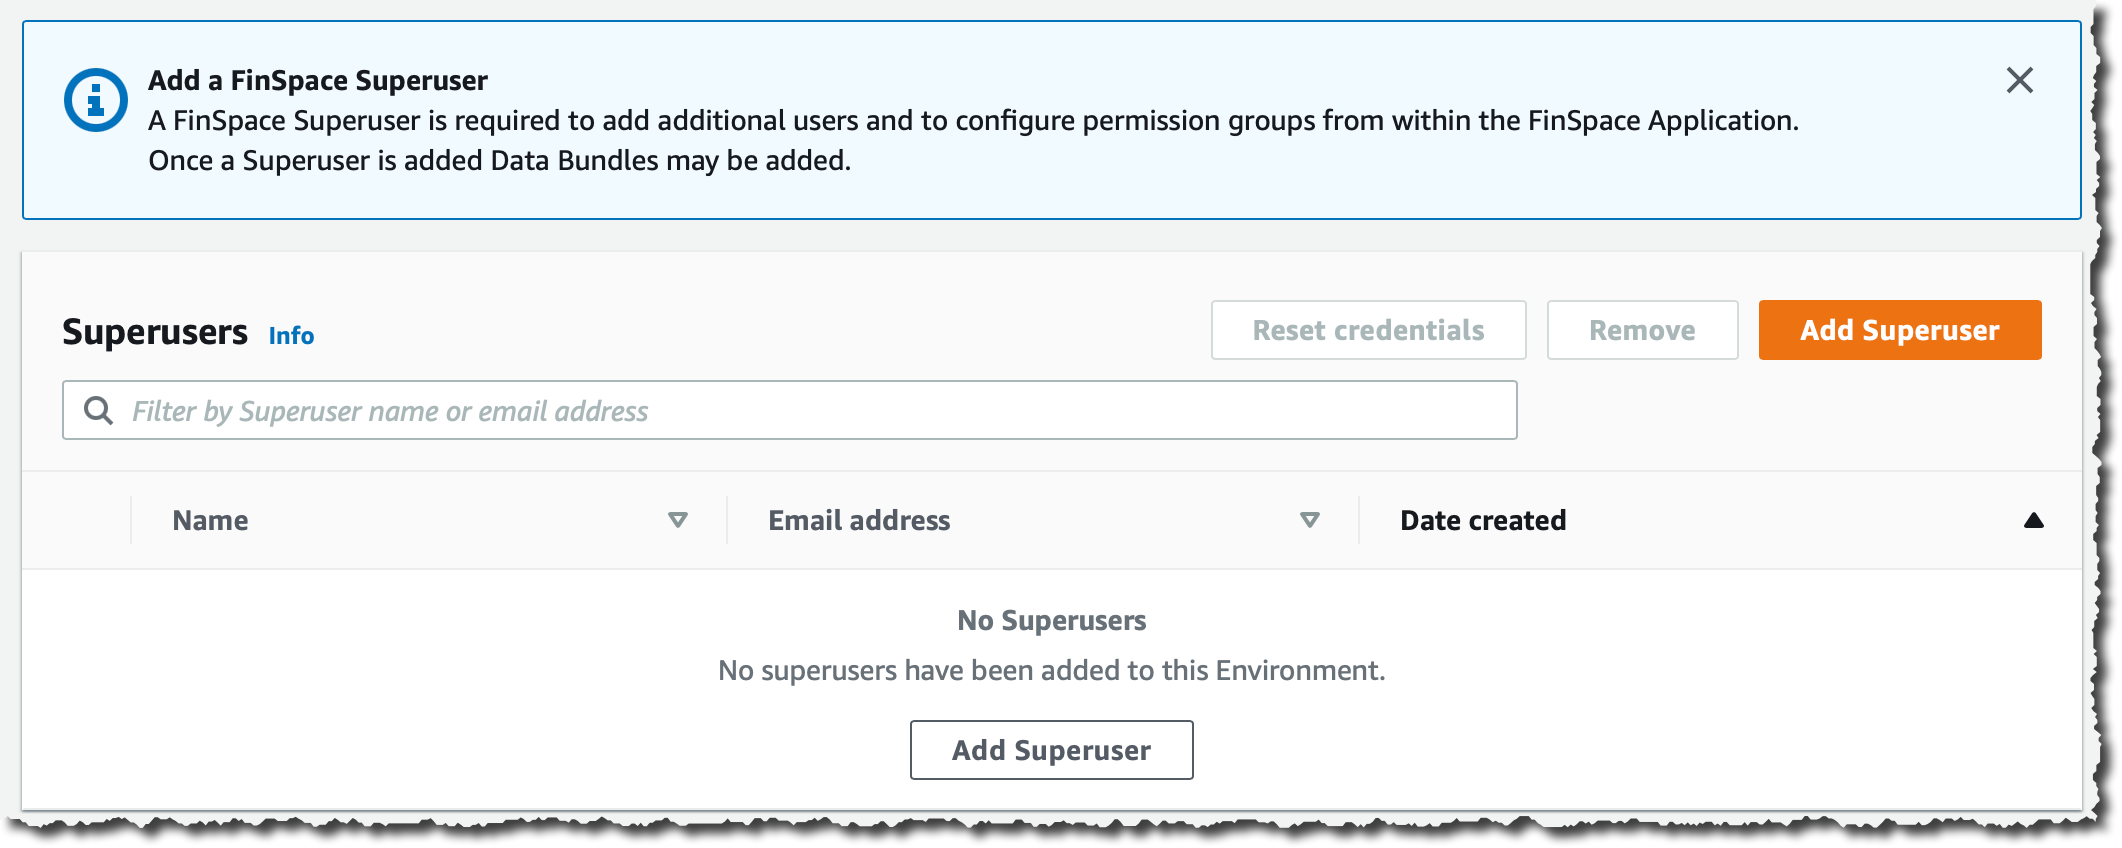
 I take a note of the temporary password. I copy the text of the message to send to my superuser. This message includes the connection instructions for the initial connection to the environment.

The superuser has permission to add other users and to manage these users’ permissions in the Amazon FinSpace environment itself.
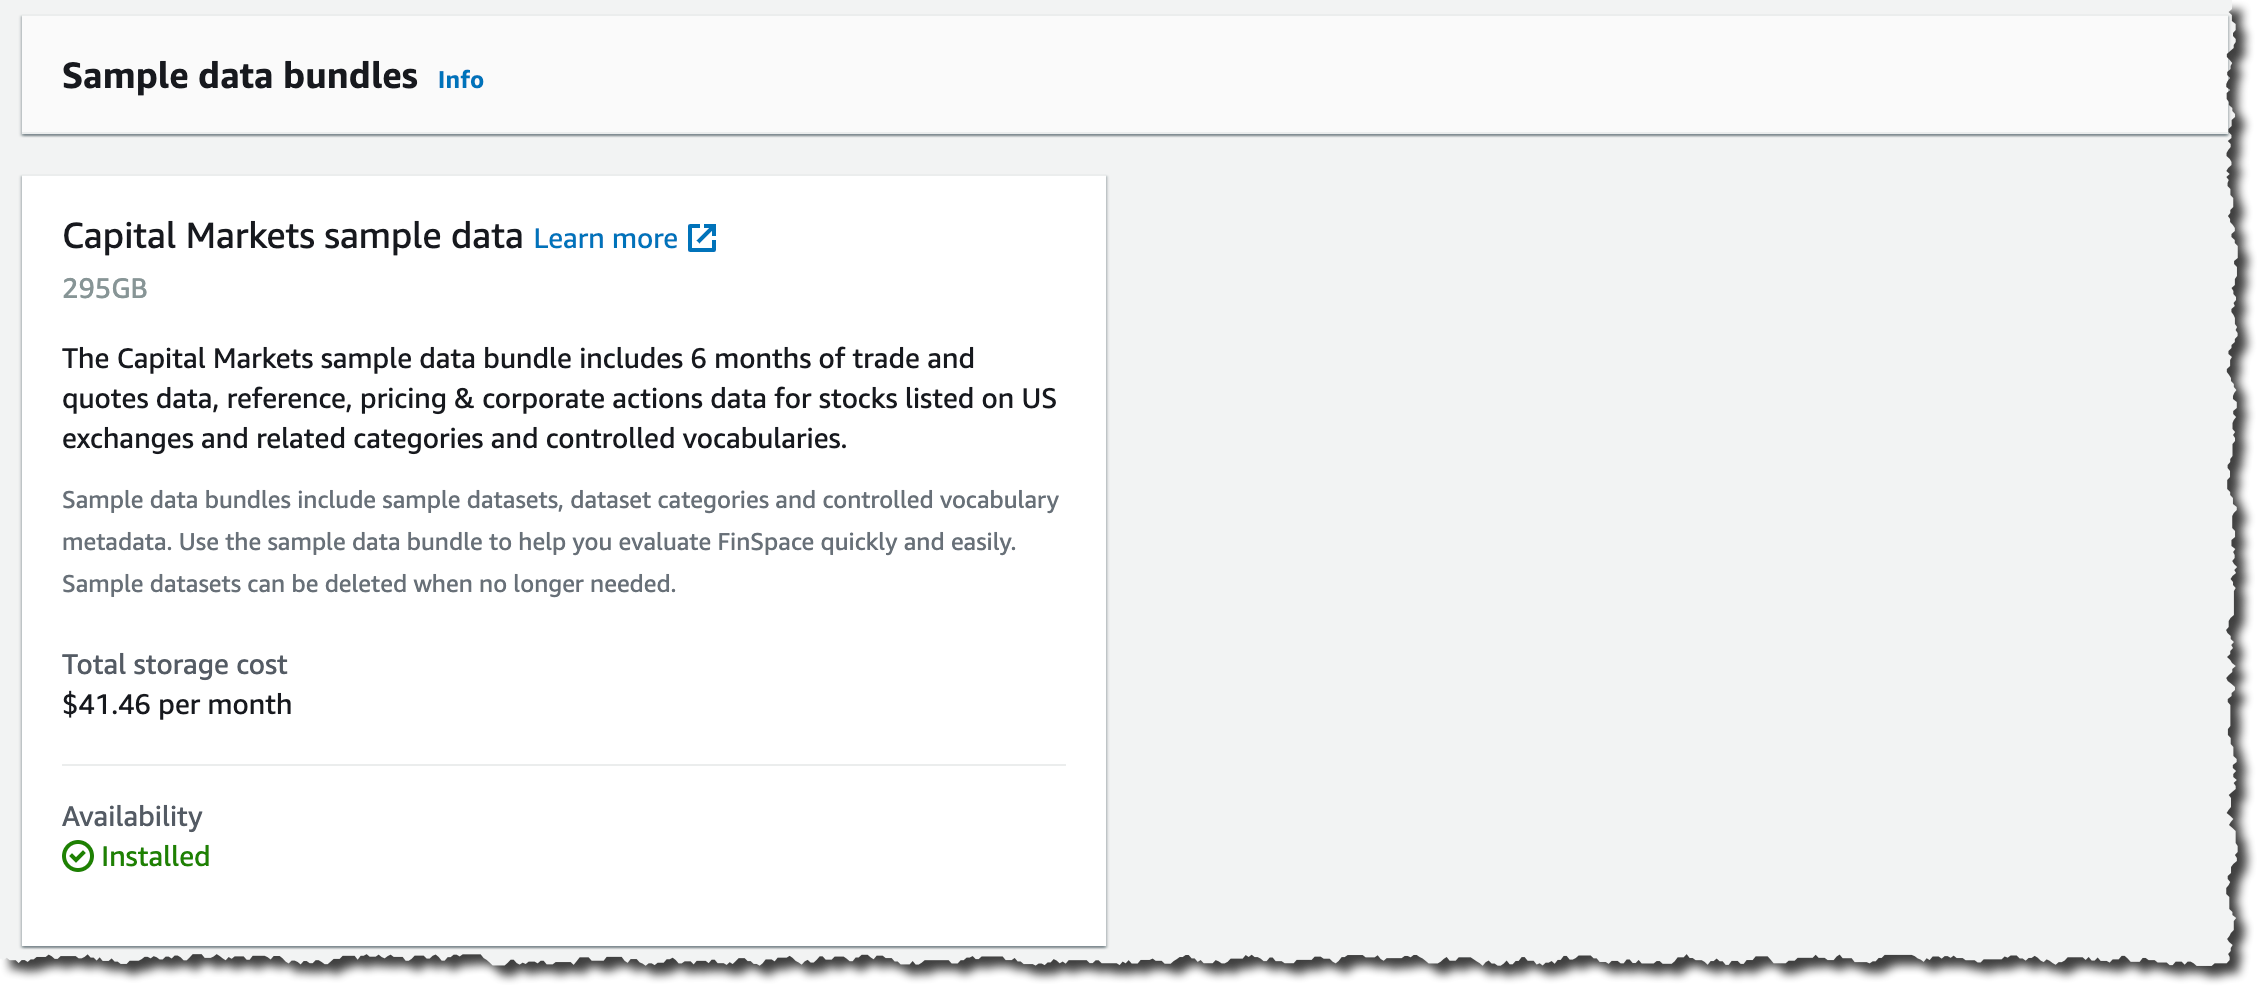
Finally, and just for the purpose of this demo, I choose to import an initial dataset. This allows me to start with some data in the environment. Doing so is just a single click in the console. The storage cost of this dataset is $41.46 / month and I can delete it at any time.
Under Sample data bundles, Capital Markets sample data, I click Install dataset. This can take several minutes, so it’s a good time to stand up, stretch your legs, and grab a cup of coffee.
How to Use an Amazon FinSpace Environment
In my role as financial analyst, my AWS account administrator sends me an email containing a URL to connect to my Amazon FinSpace Environment along with the related credentials. I connect to the Amazon FinSpace environment.
A couple of points are worth noting on the welcome page. First, on the top right side, I click the gear icon to access the environment settings. This is where I can add other users and manage their permissions. Second, you can browse the different data by categories on the left side, or search for specific terms by typing your search query on the search bar on top of the screen, and refine your search on the left side.
I can use Amazon FinSpace as my data hub. Data are fed through the API or I can load data directly from my workstation. I use tags to describe datasets. Datasets are containers for data; changes are versioned and I can create historical views of data or use the auto-updating data view that Amazon FinSpace maintains for me.
For this demo, let’s imagine I received a request from a portfolio manager who wants a chart showing realized volatility using 5 minute time bars for AMZN stock. Let me show you how I use the search bar to locate data and then use a notebook to analyze that data.
First, I search my dataset for stock price time bar summary, with 5 min intervals. I type “equity” in the search box. I’m lucky: The first result is the one I want. If needed, I could have refined the results using the facets on the left.

Once I find the dataset, I explore its description, the schema, and other information. Based on these, I decide if this is the correct dataset to answer my portfolio manager’s request.

I click Analyze in notebook to start a Jupyter notebook where I’ll be able to further explore the data with PySpark. Once the notebook is open, I first check it is correctly configured to use the Amazon FinSpace PySpark kernel (starting the kernel takes 5-8 minutes).

I click “play” on the first code box to connect to the Spark cluster.

To analyze my dataset and answer the specific question from my PM, I need to type a bit of PySpark code. For the purpose of this demo, I am using sample code from the Amazon FinSpace GitHub repository. You can upload the Notebook to your environment. Click the up arrow as shown on the top left of the screen above to select the file from your local machine.
This notebook pulls data from the Amazon FinSpace catalog “US Equity Time-Bar Summary” data I found earlier, and then uses the Amazon FinSpace built-in analytic function realized_volatility() to compute realized volatility for a group of tickers and exchange event types.
Before creating any graph, let’s have a sense of the dataset. What is the time range of the data ? What tickers are in this dataset ? I answer these questions with simple select() or groupby() functions provided by Amazon FinSpace. I prepare my FinSpaceAnalyticsAnalyser class with the code below :
from aws.finspace.analytics import FinSpaceAnalyticsManager
finspace = FinSpaceAnalyticsManager(spark = spark, endpoint=hfs_endpoint)

sumDF = finspace.read_data_view(dataset_id = dataset_id, data_view_id = view_id)
Once done, I can start to explore the dataset:

I can see there are 561778 AMZN trades and price quotes between Oct. 1, 2019 and March 31, 2020.
To plot the realized volatility, I use Panda to plot the values:

When I execute this code block, I receive:

Similarly, I can start a Bollinger Bands analysis to check if the volatility spike created an oversold condition on the AMZN stock. I am also using Panda to plot the values.

and generate this graph:
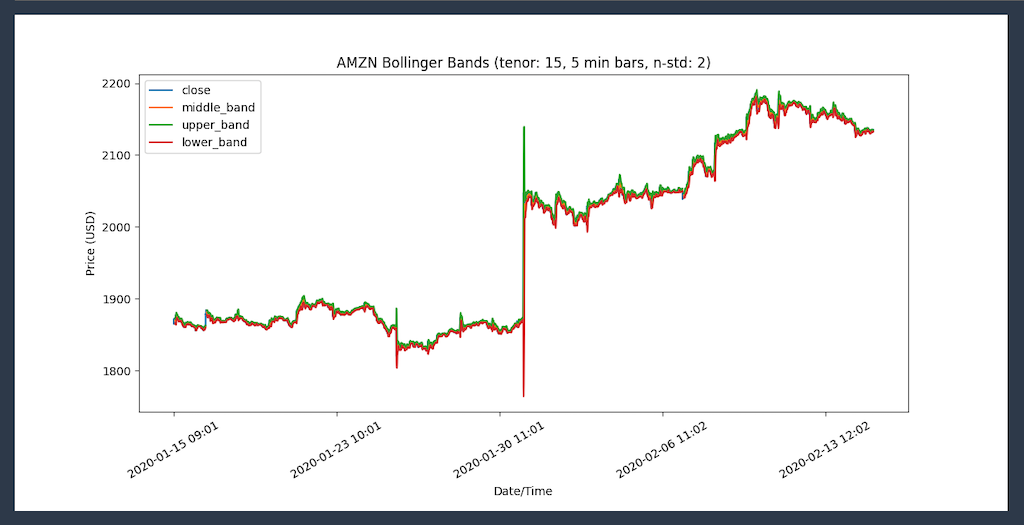
I am ready to answer the portfolio manager’s question. But why was there a spike on Jan 30 2020 ? The answer is in the news: “Amazon soars after huge earnings beat.” 🙂
Availability and Pricing
Amazon FinSpace is available today in US East (N. Virginia), US East (Ohio), US West (Oregon), Europe (Ireland), and Canada (Central).
As usual, we charge you only for the resources your project uses. Pricing is based on three dimensions: the number of analysts with access to the service, the volume of data ingested, and the compute hours used to apply your transformations. Detailed pricing information is available on the service pricing page.
Give it a try today and let us know your feedback.


Source: AWS News