Store and Access Time Series Data at Any Scale with Amazon Timestream – Now Generally Available
Time series are a very common data format that describes how things change over time. Some of the most common sources are industrial machines and IoT devices, IT infrastructure stacks (such as hardware, software, and networking components), and applications that share their results over time. Managing time series data efficiently is not easy because the data model doesn’t fit general-purpose databases.
For this reason, I am happy to share that Amazon Timestream is now generally available. Timestream is a fast, scalable, and serverless time series database service that makes it easy to collect, store, and process trillions of time series events per day up to 1,000 times faster and at as little as to 1/10th the cost of a relational database.
This is made possible by the way Timestream is managing data: recent data is kept in memory and historical data is moved to cost-optimized storage based on a retention policy you define. All data is always automatically replicated across multiple availability zones (AZ) in the same AWS region. New data is written to the memory store, where data is replicated across three AZs before returning success of the operation. Data replication is quorum based such that the loss of nodes, or an entire AZ, does not disrupt durability or availability. In addition, data in the memory store is continuously backed up to Amazon Simple Storage Service (S3) as an extra precaution.
Queries automatically access and combine recent and historical data across tiers without the need to specify the storage location, and support time series-specific functionalities to help you identify trends and patterns in data in near real time.
There are no upfront costs, you pay only for the data you write, store, or query. Based on the load, Timestream automatically scales up or down to adjust capacity, without the need to manage the underlying infrastructure.
Timestream integrates with popular services for data collection, visualization, and machine learning, making it easy to use with existing and new applications. For example, you can ingest data directly from AWS IoT Core, Amazon Kinesis Data Analytics for Apache Flink, and Amazon MSK. You can visualize data stored in Timestream from Amazon QuickSight, and use Amazon SageMaker to apply machine learning algorithms to time series data, for example for anomaly detection. You can use Timestream fine-grained AWS Identity and Access Management (IAM) permissions to easily ingest or query data from an AWS Lambda function. We are providing the tools to use Timestream with open source platforms such as Apache Kafka, Telegraf, Prometheus, and Grafana.
Using Amazon Timestream from the Console
In the Timestream console, I select Create database. I can choose to create a Standard database or a Sample database populated with sample data. I proceed with a standard database and I name it MyDatabase.

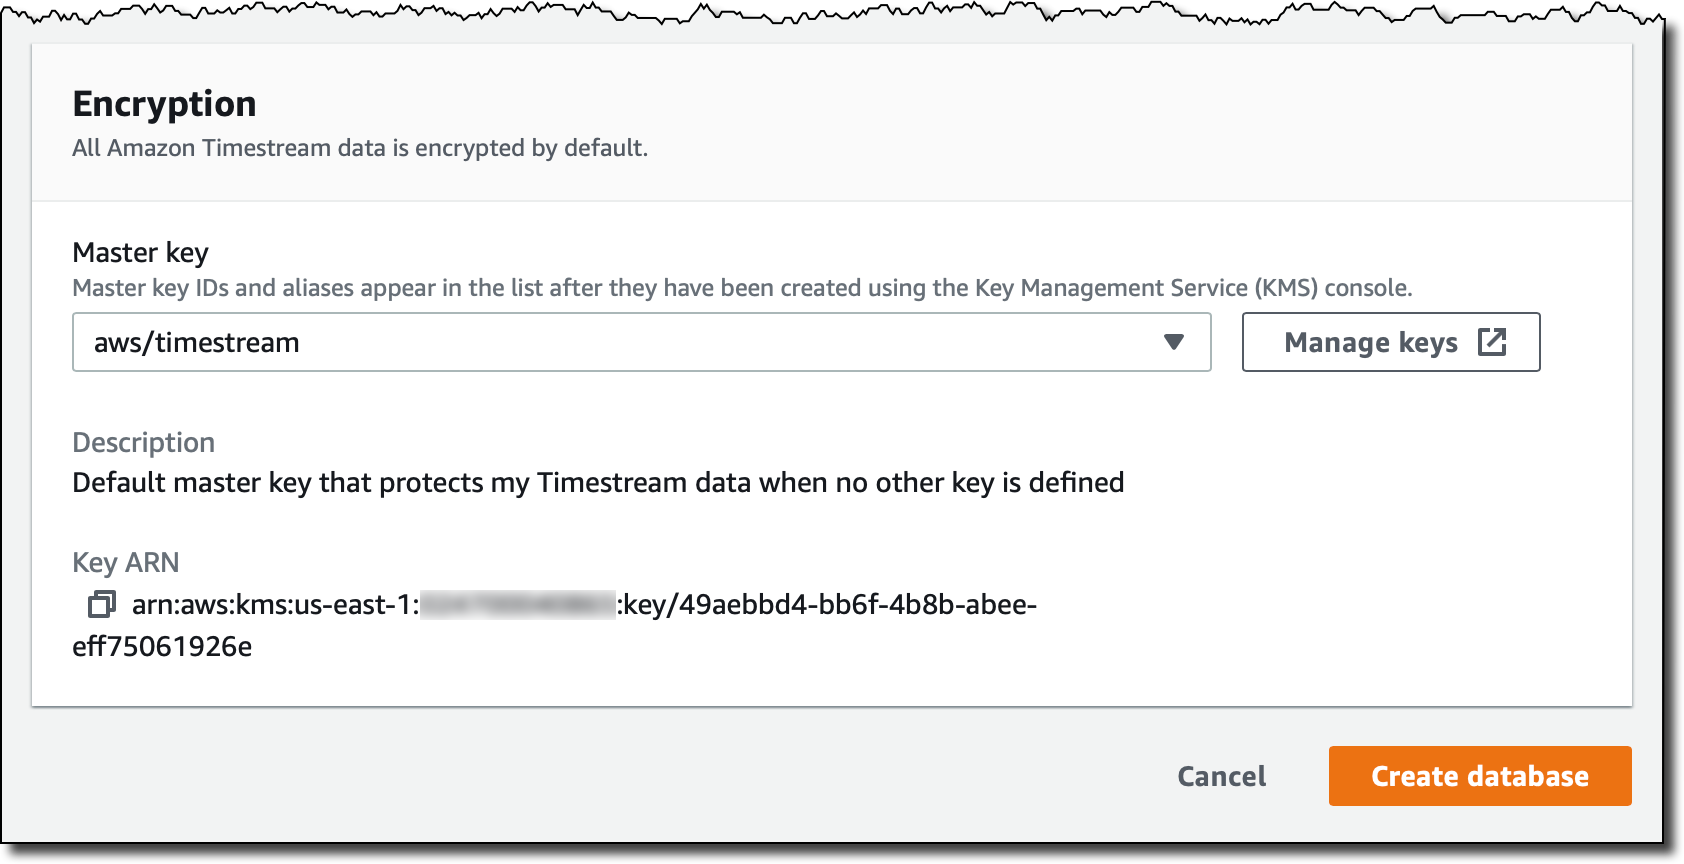
All Timestream data is encrypted by default. I use the default master key, but you can use a customer managed key that you created using AWS Key Management Service (KMS). In that way, you can control the rotation of the master key, and who has permissions to use or manage it.
I complete the creation of the database. Now my database is empty. I select Create table and name it MyTable.

Each table has its own data retention policy. First data is ingested in the memory store, where it can be stored from a minimum of one hour to a maximum of a year. After that, it is automatically moved to the magnetic store, where it can be kept up from a minimum of one day to a maximum of 200 years, after which it is deleted. In my case, I select 1 hour of memory store retention and 5 years of magnetic store retention.

When writing data in Timestream, you cannot insert data that is older than the retention period of the memory store. For example, in my case I will not be able to insert records older than 1 hour. Similarly, you cannot insert data with a future timestamp.
I complete the creation of the table. As you noticed, I was not asked for a data schema. Timestream will automatically infer that as data is ingested. Now, let’s put some data in the table!
Loading Data in Amazon Timestream
Each record in a Timestream table is a single data point in the time series and contains:
- The measure name, type, and value. Each record can contain a single measure, but different measure names and types can be stored in the same table.
- The timestamp of when the measure was collected, with nanosecond granularity.
- Zero or more dimensions that describe the measure and can be used to filter or aggregate data. Records in a table can have different dimensions.
For example, let’s build a simple monitoring application collecting CPU, memory, swap, and disk usage from a server. Each server is identified by a hostname and has a location expressed as a country and a city.
In this case, the dimensions would be the same for all records:
countrycityhostname
Records in the table are going to measure different things. The measure names I use are:
cpu_utilizationmemory_utilizationswap_utilizationdisk_utilization
Measure type is DOUBLE for all of them.
For the monitoring application, I am using Python. To collect monitoring information I use the psutil module that I can install with:
Here’s the code for the collect.py application:
import time
import boto3
import psutil

from botocore.config import Config

DATABASE_NAME = "MyDatabase"
TABLE_NAME = "MyTable"

COUNTRY = "UK"
CITY = "London"
HOSTNAME = "MyHostname" # You can make it dynamic using socket.gethostname()

INTERVAL = 1 # Seconds

def prepare_record(measure_name, measure_value):
    record = {
        'Time': str(current_time),
        'Dimensions': dimensions,
        'MeasureName': measure_name,
        'MeasureValue': str(measure_value),
        'MeasureValueType': 'DOUBLE'
    }
    return record


def write_records(records):
    try:
        result = write_client.write_records(DatabaseName=DATABASE_NAME,
                                            TableName=TABLE_NAME,
                                            Records=records,
                                            CommonAttributes={})
        status = result['ResponseMetadata']['HTTPStatusCode']
        print("Processed %d records. WriteRecords Status: %s" %
              (len(records), status))
    except Exception as err:
        print("Error:", err)


if __name__ == '__main__':

    session = boto3.Session()
    write_client = session.client('timestream-write', config=Config(
        read_timeout=20, max_pool_connections=5000, retries={'max_attempts': 10}))
    query_client = session.client('timestream-query')

    dimensions = [
        {'Name': 'country', 'Value': COUNTRY},
        {'Name': 'city', 'Value': CITY},
        {'Name': 'hostname', 'Value': HOSTNAME},
    ]

    records = []

    while True:

        current_time = int(time.time() * 1000)
        cpu_utilization = psutil.cpu_percent()
        memory_utilization = psutil.virtual_memory().percent
        swap_utilization = psutil.swap_memory().percent
        disk_utilization = psutil.disk_usage('/').percent

        records.append(prepare_record('cpu_utilization', cpu_utilization))
        records.append(prepare_record(
            'memory_utilization', memory_utilization))
        records.append(prepare_record('swap_utilization', swap_utilization))
        records.append(prepare_record('disk_utilization', disk_utilization))

        print("records {} - cpu {} - memory {} - swap {} - disk {}".format(
            len(records), cpu_utilization, memory_utilization,
            swap_utilization, disk_utilization))

        if len(records) == 100:
            write_records(records)
            records = []

        time.sleep(INTERVAL)
I start the collect.py application. Every 100 records, data is written in the MyData table:
Now, in the Timestream console, I see the schema of the MyData table, automatically updated based on the data ingested:
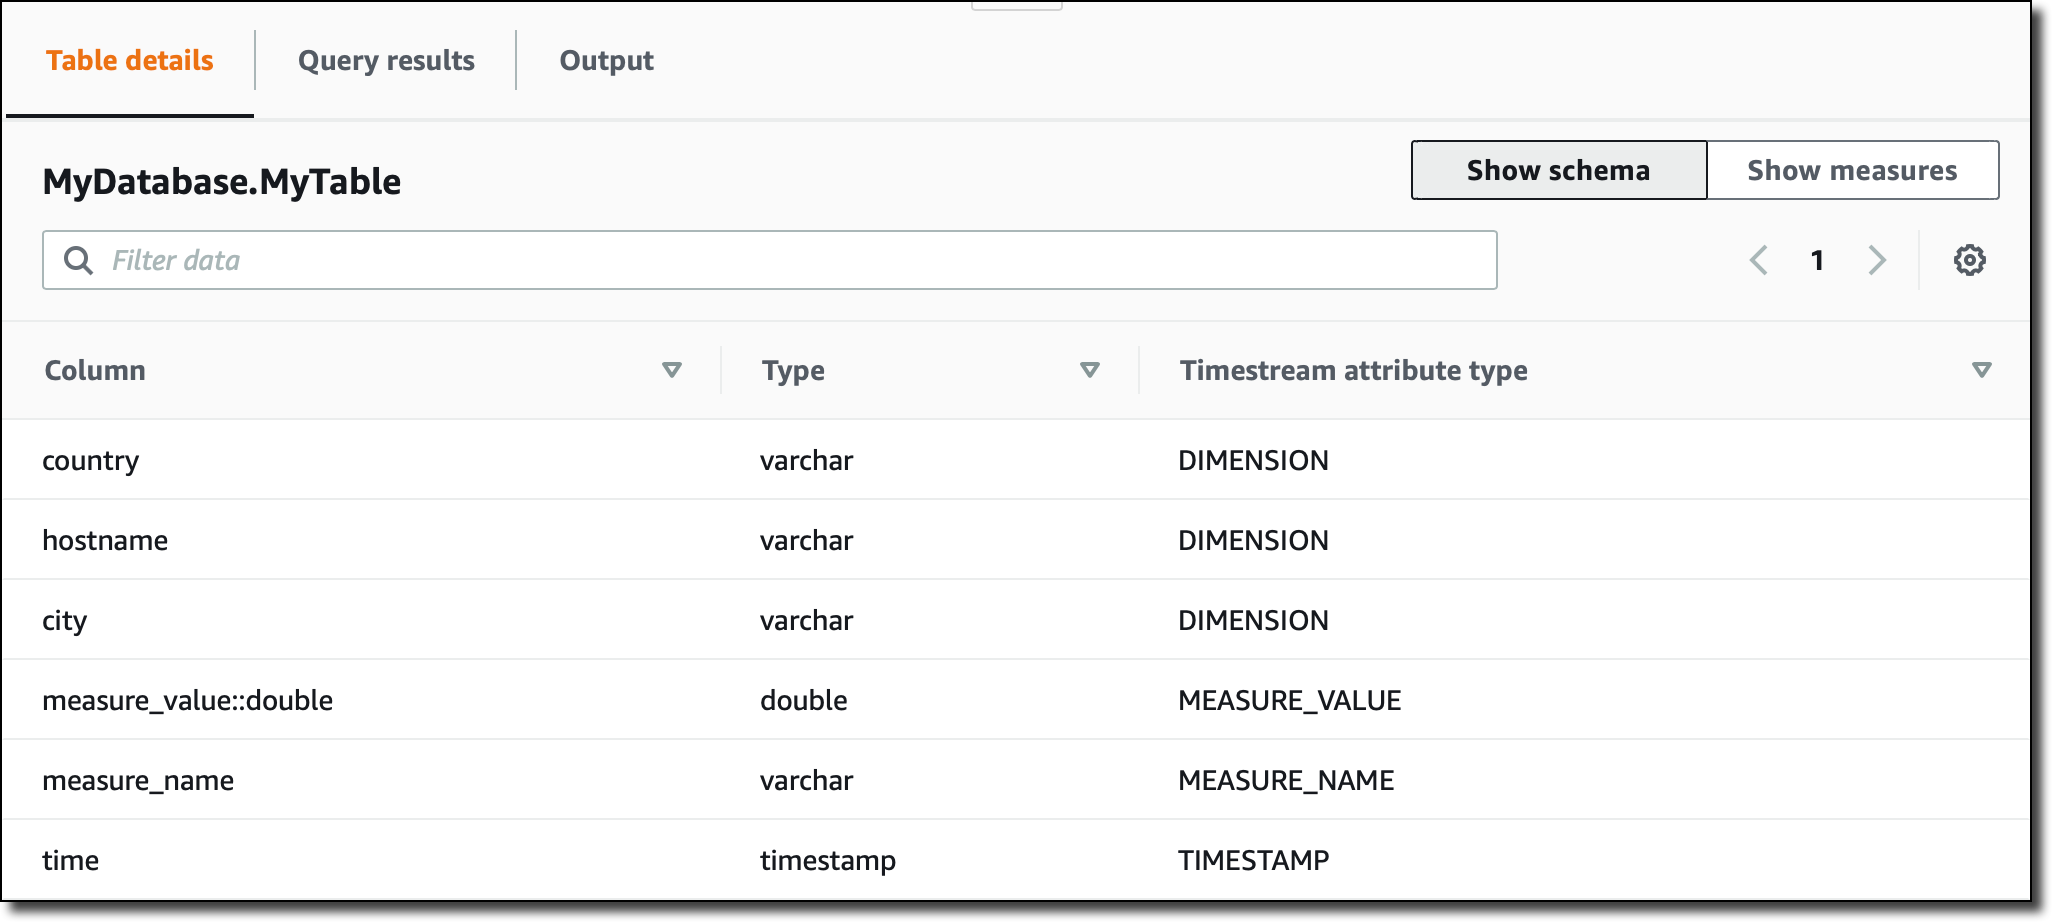
Note that, since all measures in the table are of type DOUBLE, the measure_value::double column contains the value for all of them. If the measures were of different types (for example, INT or BIGINT) I would have more columns (such as measure_value::int and measure_value::bigint) .
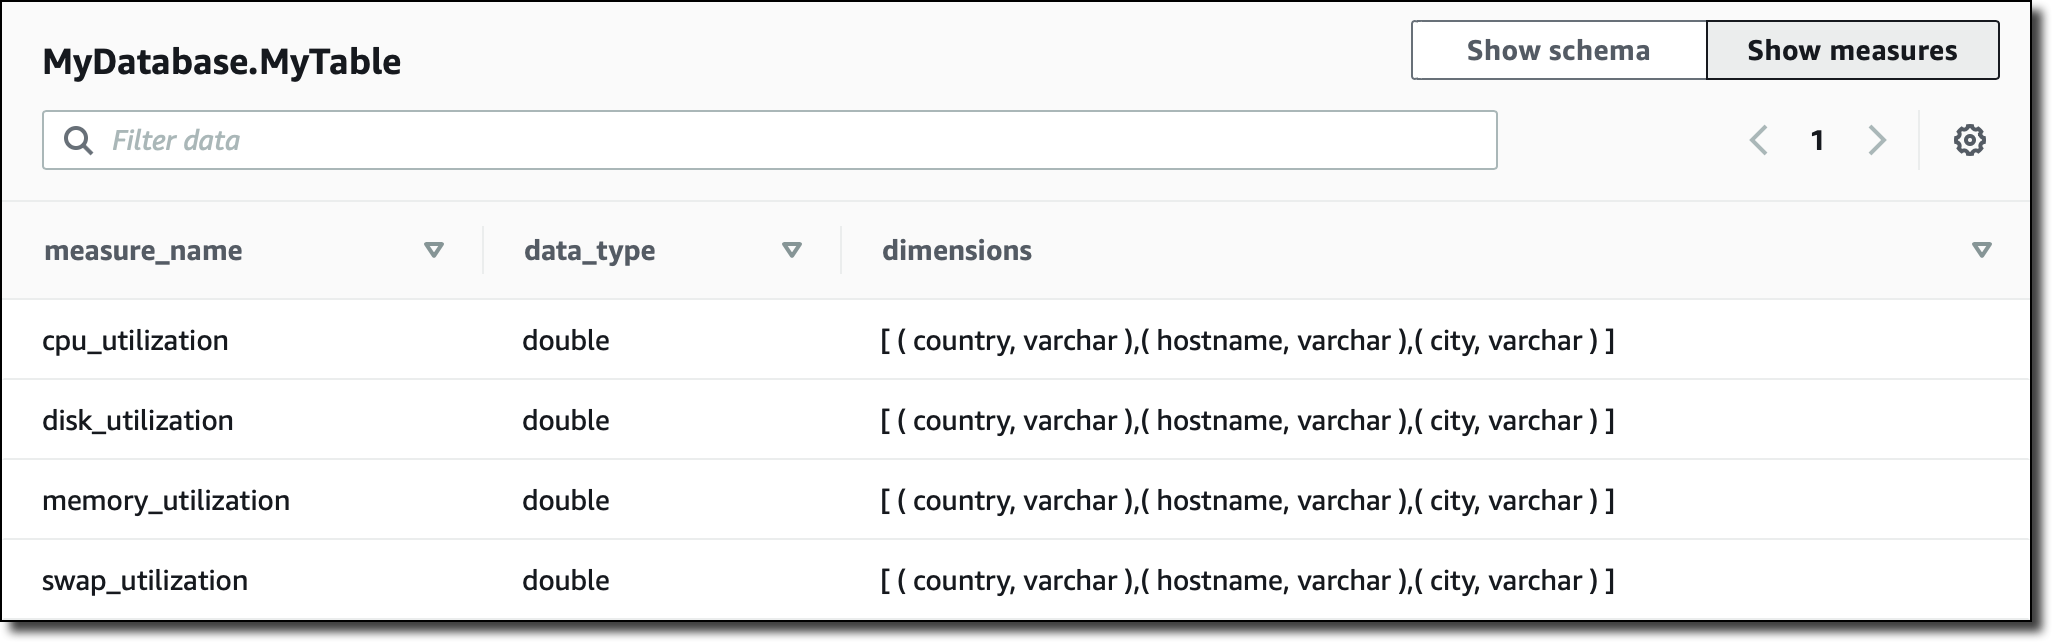
In the console, I can also see a recap of which kind measures I have in the table, their corresponding data type, and the dimensions used for that specific measure:
Querying Data from the Console
I can query time series data using SQL. The memory store is optimized for fast point-in-time queries, while the magnetic store is optimized for fast analytical queries. However, queries automatically process data on all stores (memory and magnetic) without having to specify the data location in the query.
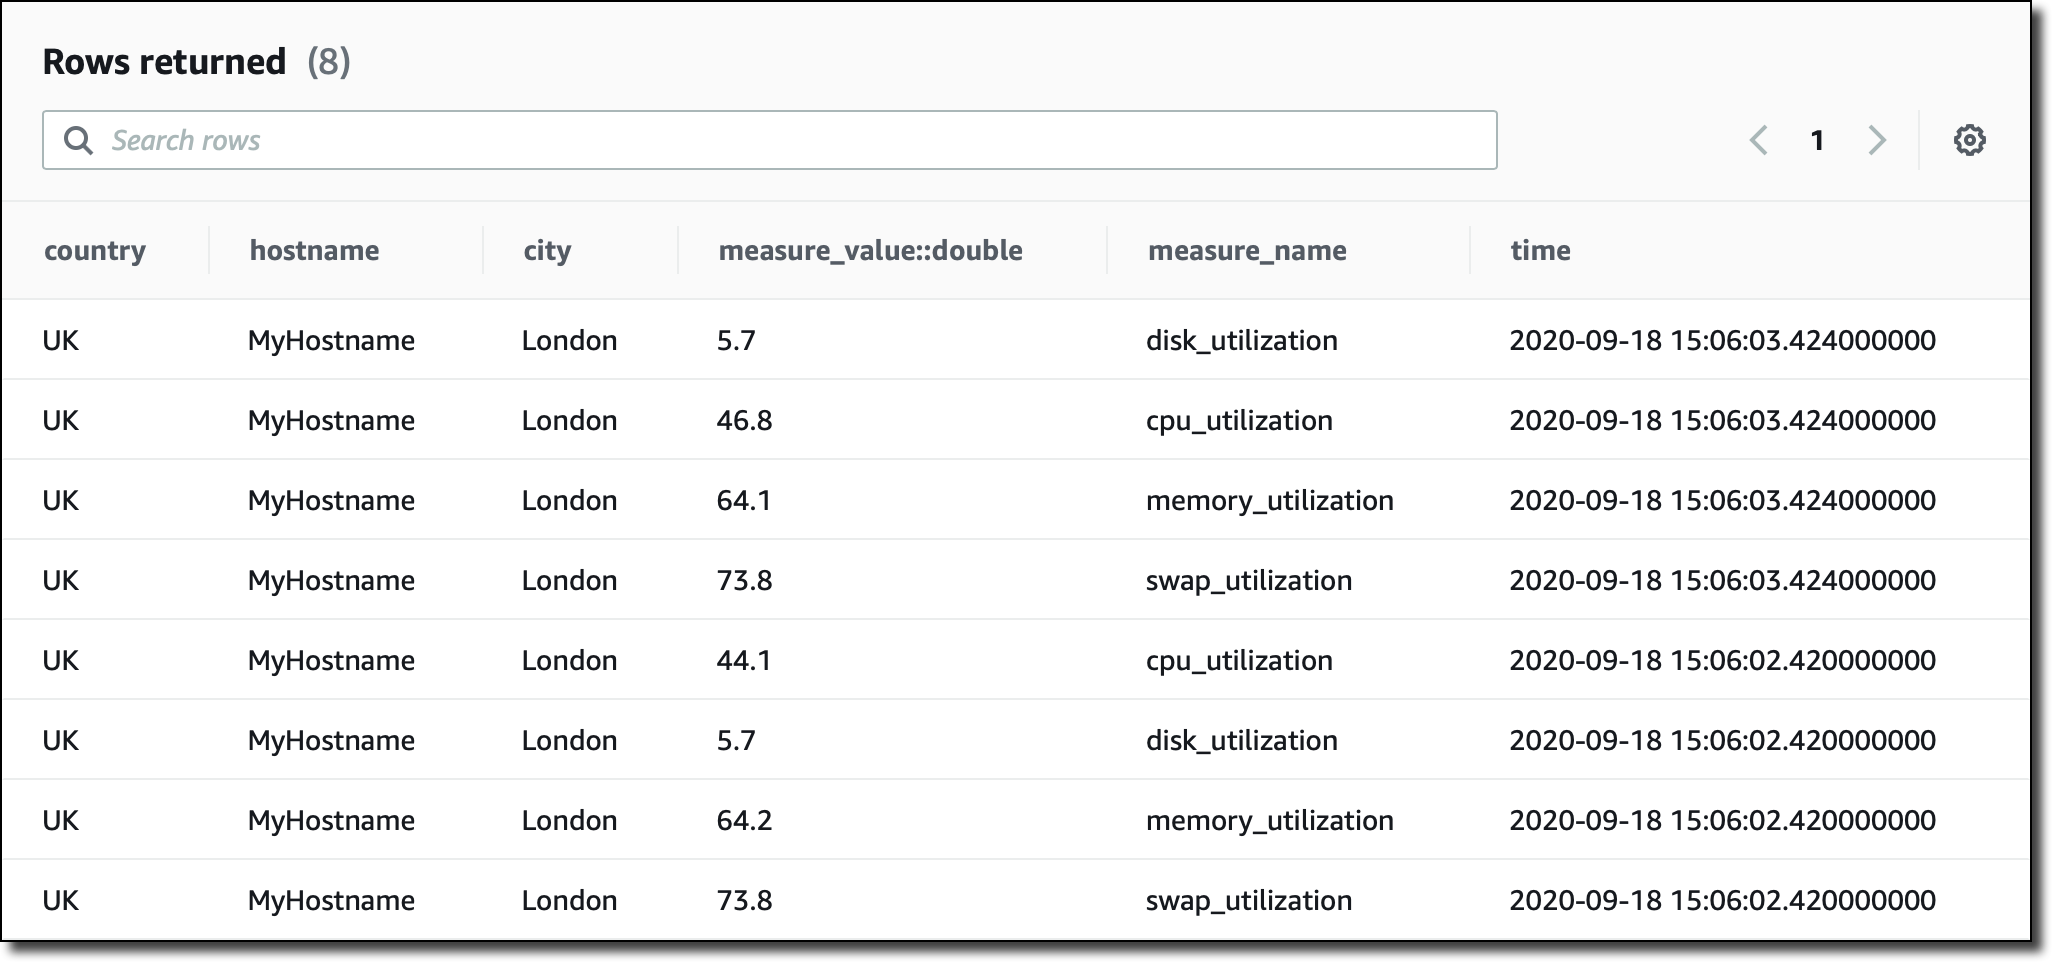
I am running queries straight from the console, but I can also use JDBC connectivity to access the query engine. I start with a basic query to see the most recent records in the table:
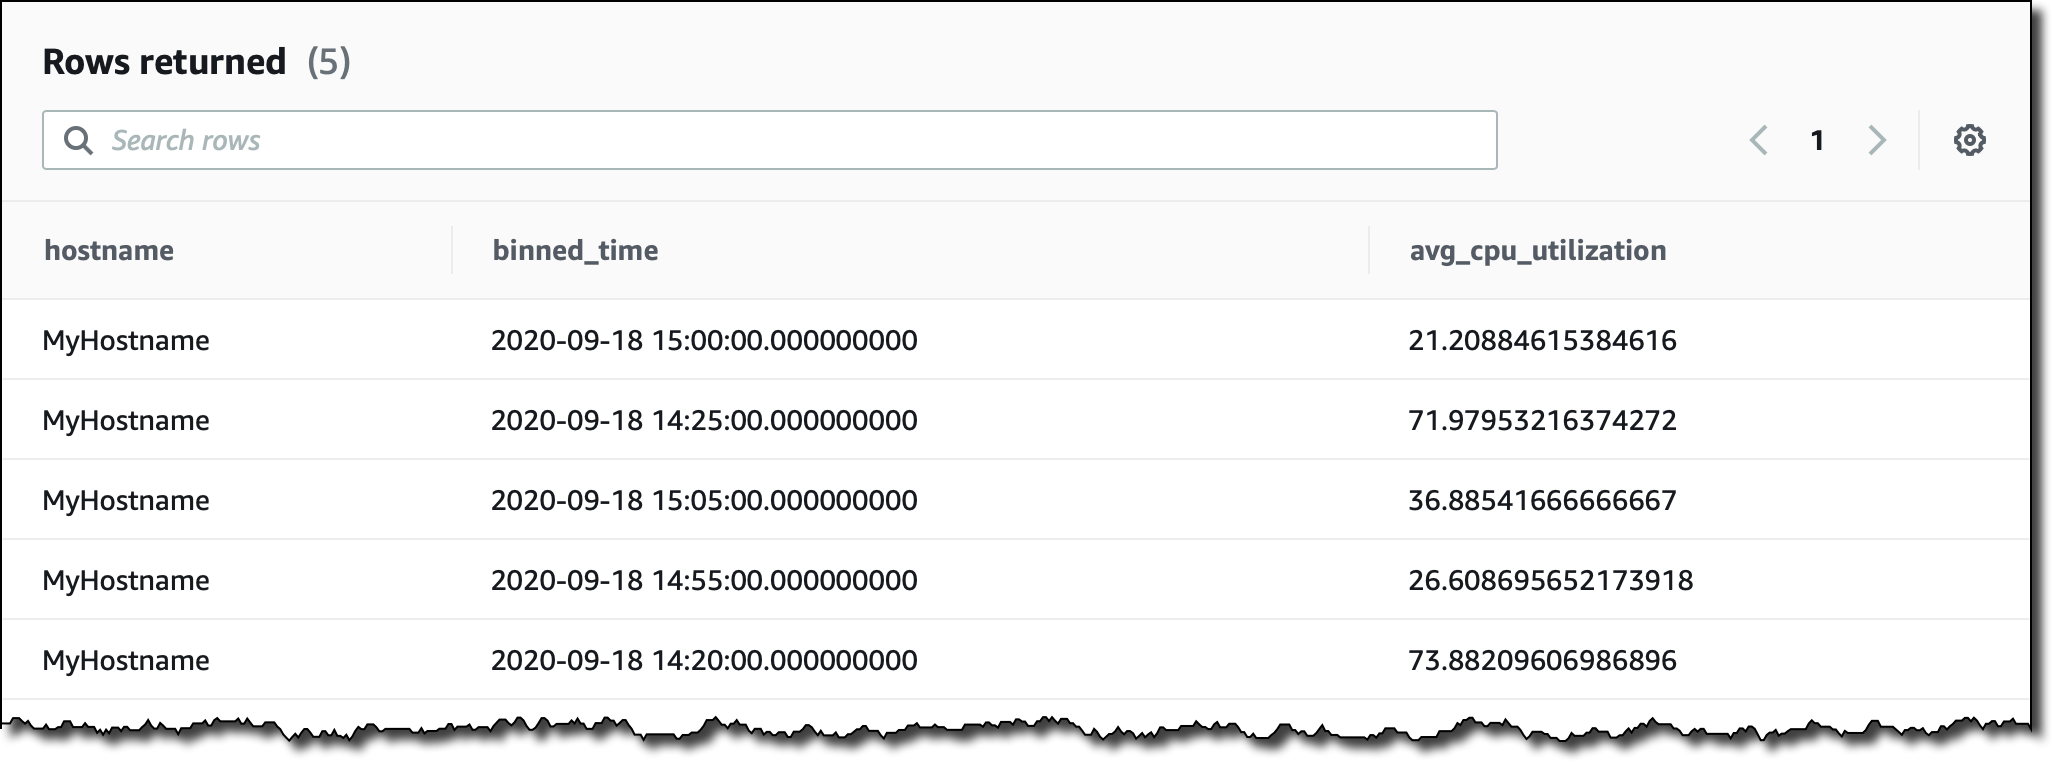
Let’s try something a little more complex. I want to see the average CPU utilization aggregated by hostname in 5 minutes intervals for the last two hours. I filter records based on the content of measure_name. I use the function bin() to round time to a multiple of an interval size, and the function ago() to compare timestamps:
When collecting time series data you may miss some values. This is quite common especially for distributed architectures and IoT devices. Timestream has some interesting functions that you can use to fill in the missing values, for example using linear interpolation, or based on the last observation carried forward.
More generally, Timestream offers many functions that help you to use mathematical expressions, manipulate strings, arrays, and date/time values, use regular expressions, and work with aggregations/windows.
To experience what you can do with Timestream, you can create a sample database and add the two IoT and DevOps datasets that we provide. Then, in the console query interface, look at the sample queries to get a glimpse of some of the more advanced functionalities:

Using Amazon Timestream with Grafana
One of the most interesting aspects of Timestream is the integration with many platforms. For example, you can visualize your time series data and create alerts using Grafana 7.1 or higher. The Timestream plugin is part of the open source edition of Grafana.
I add a new GrafanaDemo table to my database, and use another sample application to continuously ingest data. The application simulates performance data collected from a microservice architecture running on thousands of hosts.
I install Grafana on an Amazon Elastic Compute Cloud (EC2) instance and add the Timestream plugin using the Grafana CLI.
I use SSH Port Forwarding to access the Grafana console from my laptop:
In the Grafana console, I configure the plugin with the right AWS credentials, and the Timestream database and table. Now, I can select the sample dashboard, distributed as part of the Timestream plugin, using data from the GrafanaDemo table where performance data is continuously collected:

Available Now
Amazon Timestream is available today in US East (N. Virginia), Europe (Ireland), US West (Oregon), and US East (Ohio). You can use Timestream with the console, the AWS Command Line Interface (CLI), AWS SDKs, and AWS CloudFormation. With Timestream, you pay based on the number of writes, the data scanned by the queries, and the storage used. For more information, please see the pricing page.
You can find more sample applications in this repo. To learn more, please see the documentation. It’s never been easier to work with time series, including data ingestion, retention, access, and storage tiering. Let me know what you are going to build!
— Danilo


Source: AWS News